I use Mathematica in my research, but sometimes I also use it just to draw pretty pictures of mathematical objects. Here are some of the things I've done over the years. (Click on the thumbnails to see bigger versions.) I might eventually put the Mathematica code on this page, too; in the meantime, email me if you're curious.
The abelian sandpile (Wikipedia link).
We drop grains of sand at the origin (0,0), one at a time. Each coordinate (x,y) can hold at most 3 grains of sand; if it gets 4, then they spill over to the four adjacent points: (x,y-1), (x,y+1), (x-1,y), (x+1,y).
This sandpile is generated with 220+2395 grains of sand. The 220 is because it's convenient to pick a power of 2 for the recursive calculation. The 2395 is there to reach a "tipping point": if you add one more grain of sand, the sandpile cascades and gets slightly bigger. (I suspect that the tipping points are slightly more regular and therefore nicer to look at than average.)
It's not the prettiest of the fractals, but it's one of the more computationally intensive: it took a lot of work with the algorithm before my laptop could handle over a million grains of sand!
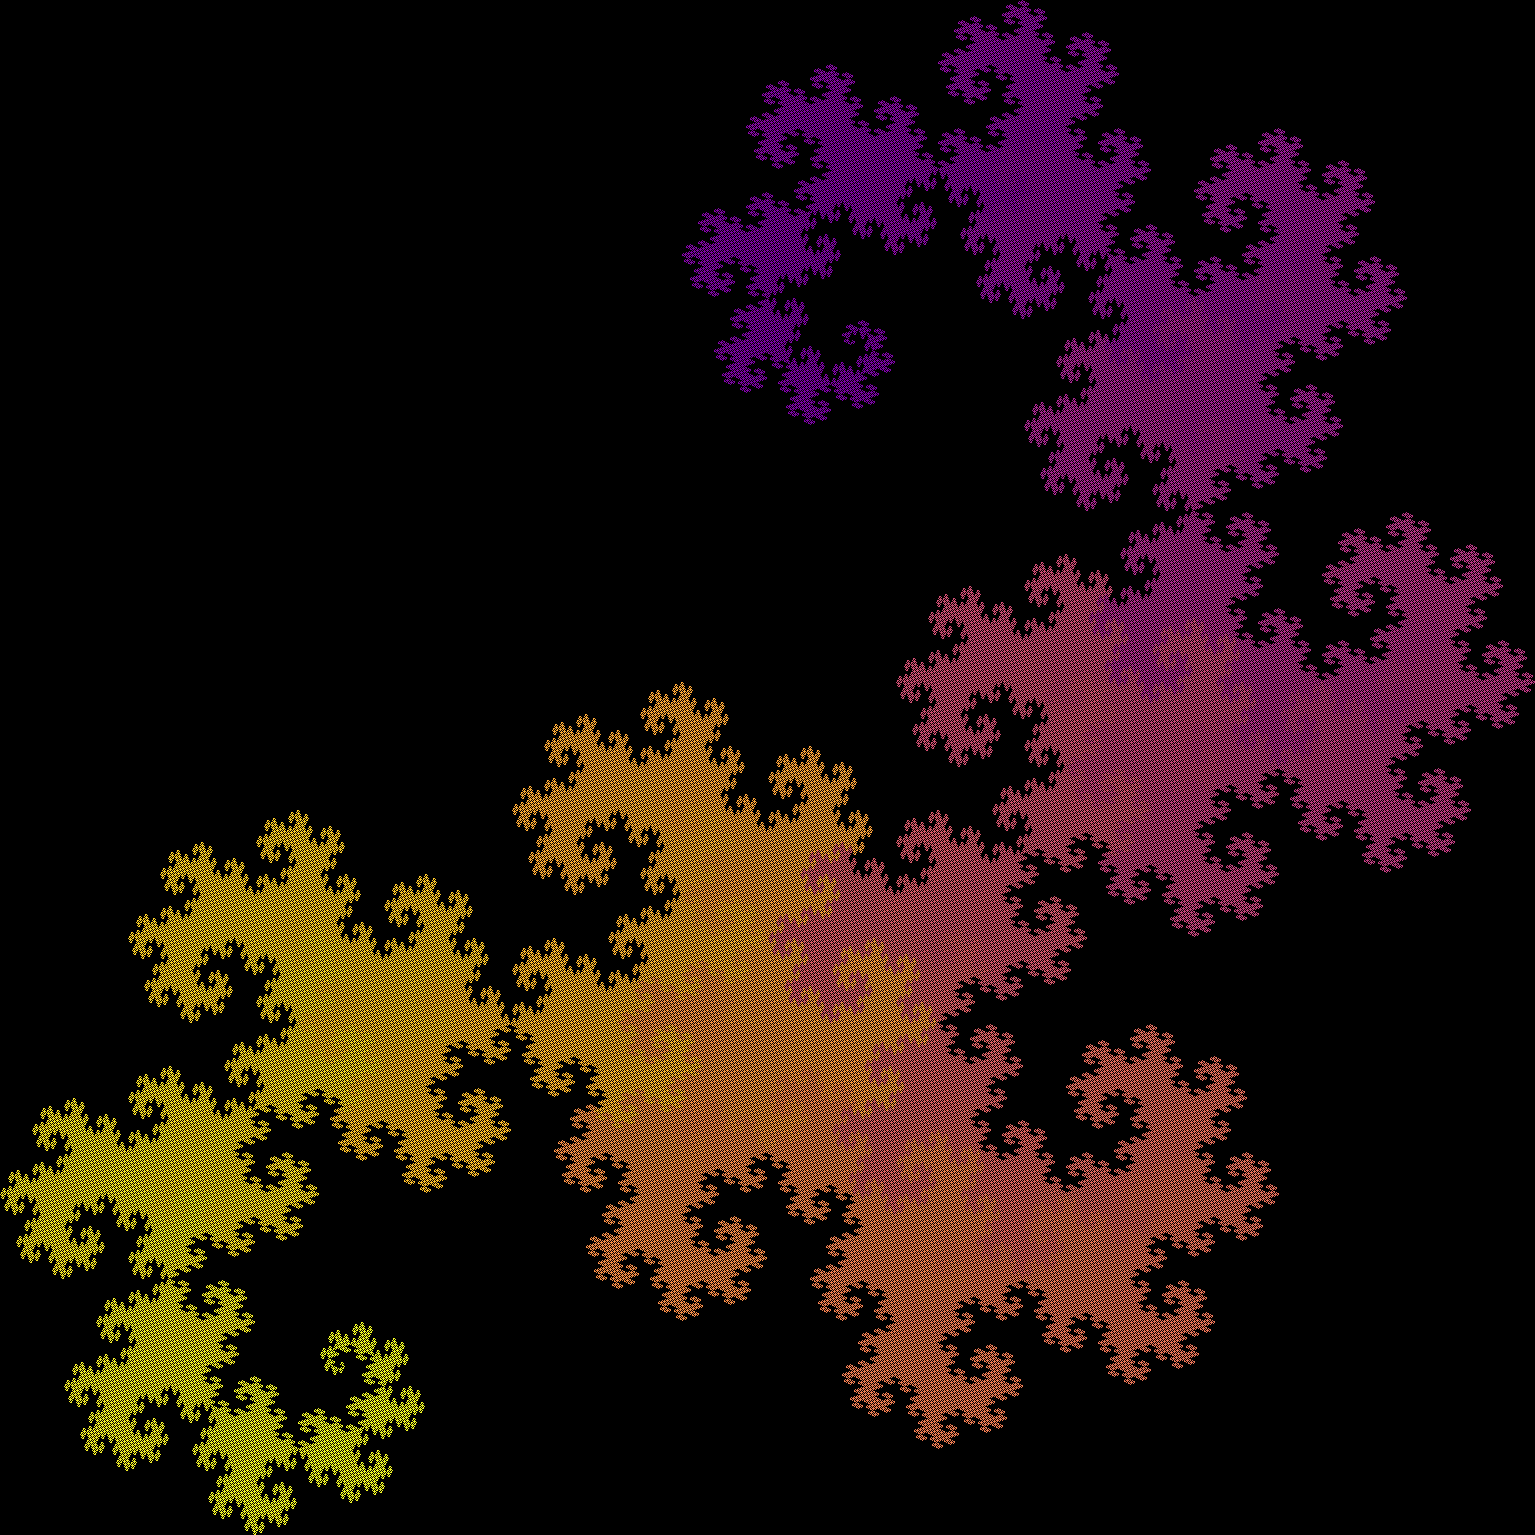
The dragon curve (Wikipedia link), a fractal popularized either by Martin Gardner or by Jurassic Park, depending on whom you ask.
This fractal can be generated by hand, literally! Take a long strip of paper. Fold it in half, lengthwise, from left to right. Without unfolding it, keep doing this several times, depending on how long and how thin the paper is. Finally, unfold it, and let the folds settle in 90 degree angles. They will form the shape of a dragon curve.
The dragon curve is almost well-suited for being drawn pixel-by-pixel, since it fits so nicely on a rectangular grid - but technically, the curve follows the lines between the squares of such a grid. To generate the image, I cheated a little, so this isn't quite a drawing of a curve, but it has the same overall shape as one.
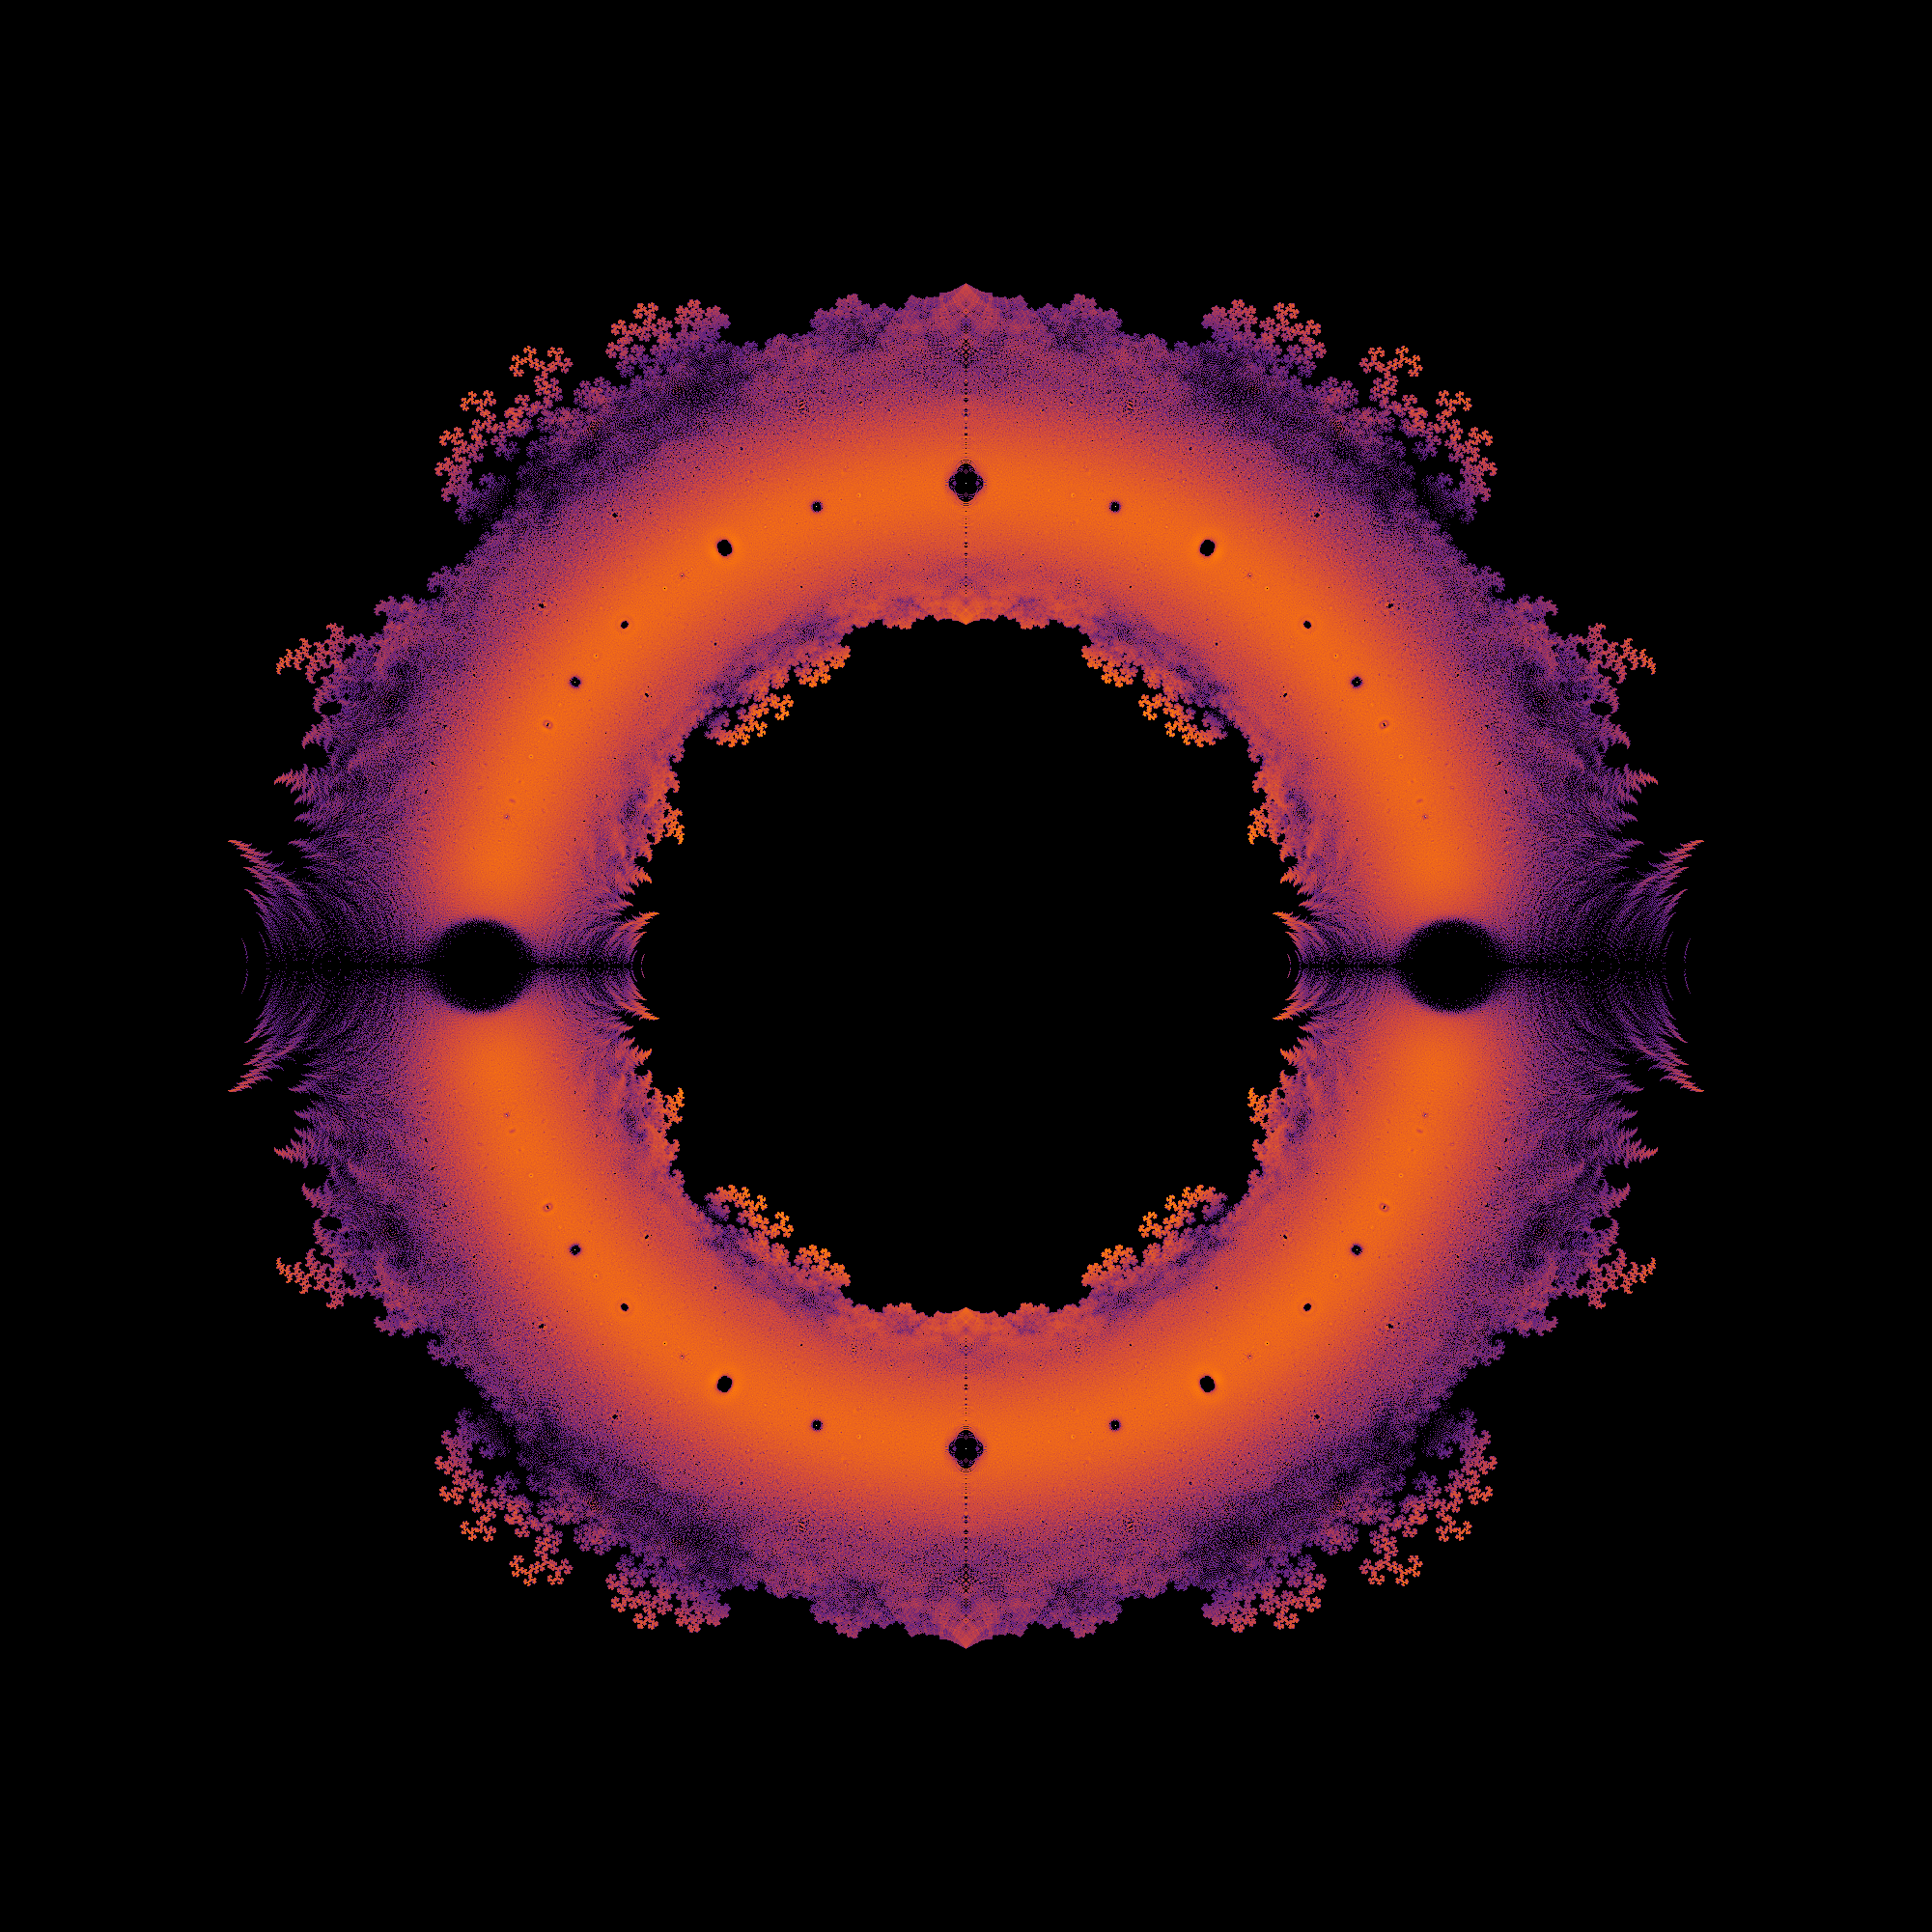
To generate this image, take all polynomials of the form ±x19±x18±...±x±1; find all their roots, with multiplicity; finally, plot all the non-real roots in the complex plane. This image is a "heat map", of sorts: I divided a 2 by 2 square of the plane into pixel-sized buckets, and the color of a pixel indicates how many roots fell into that bucket. The idea was inspired by a Reddit post I saw several years ago.
(I excluded the real roots only to make the image look prettier. There's many of them - every polynomial of degree 19 has at least one - but all they do is form a bright horizontal line segment cutting the donut shape in half.)
I can explain some of the strange things about this picture, but not all of them. For example, the reason for the large holes around 1 and -1 (and smaller holes around other roots of unity) is because, heuristically, each decently large piece of the donut should have about the same number of roots in it. A lot of the roots fall exactly at ±1, which leaves the area around these points deficient.
More recently, I found a webpage by John Baez that goes into more detail about the stranger patterns that happen in this picture.
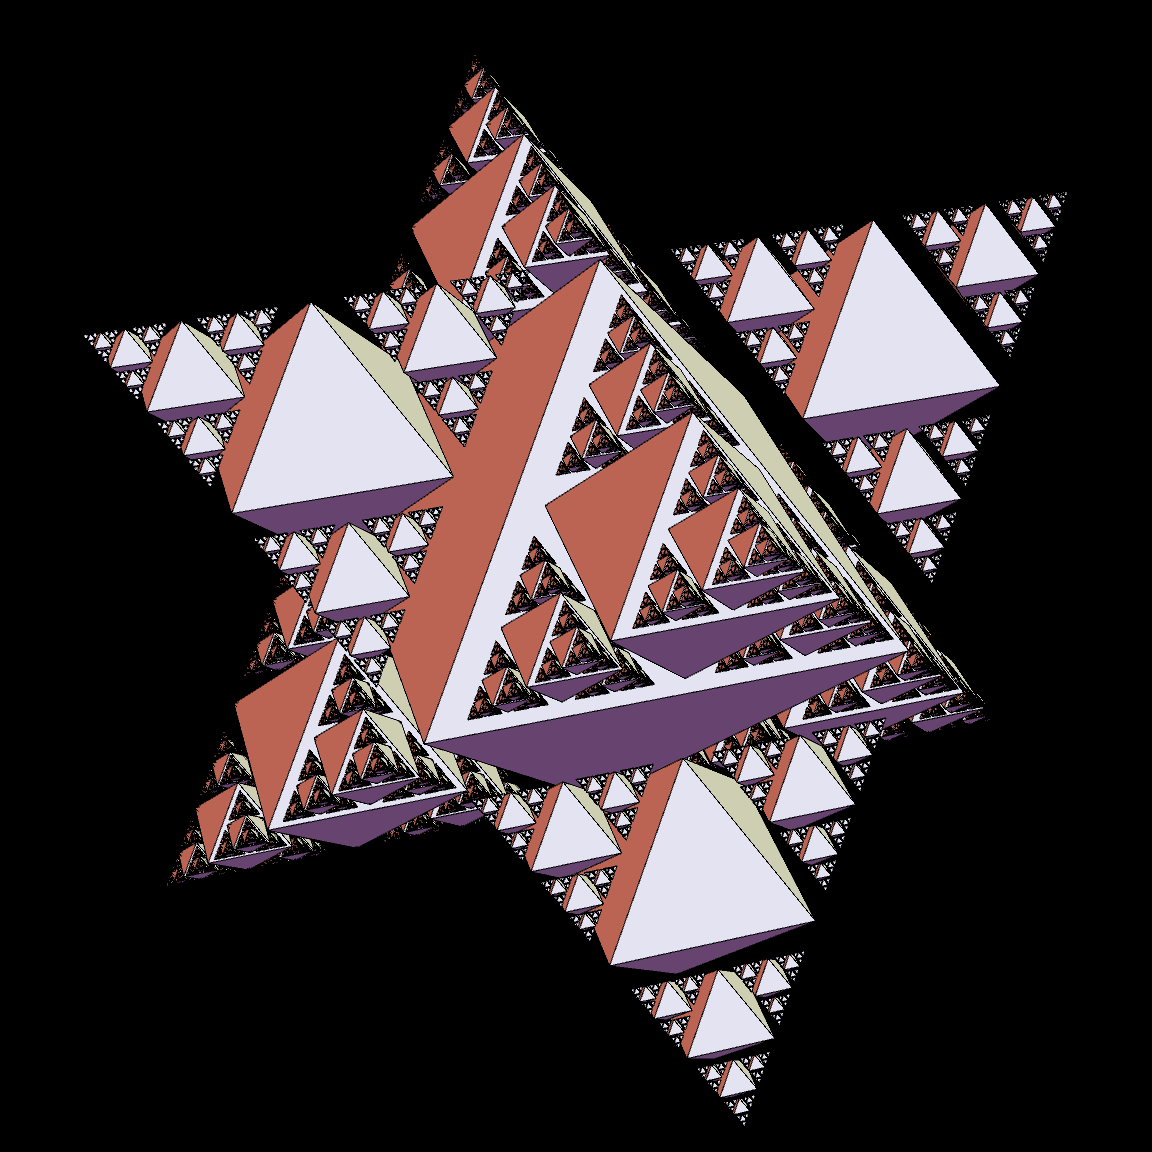
Well, it's not quite a triangle anymore.
To get the ordinary Sierpinski triangle, we divide a triangle into four equal parts, delete the middle part, and repeat on the three corners. If we do that in three-dimensional space, we start with a tetrahedron; but cutting off a tetrahedron from each corner leaves an octahedron in the middle.
Rather than deleting the octahedron entirely, I kept it around, just scaled down. Also, this image includes two of these fractals, placed on top of each other so that they share the same central octahedron.
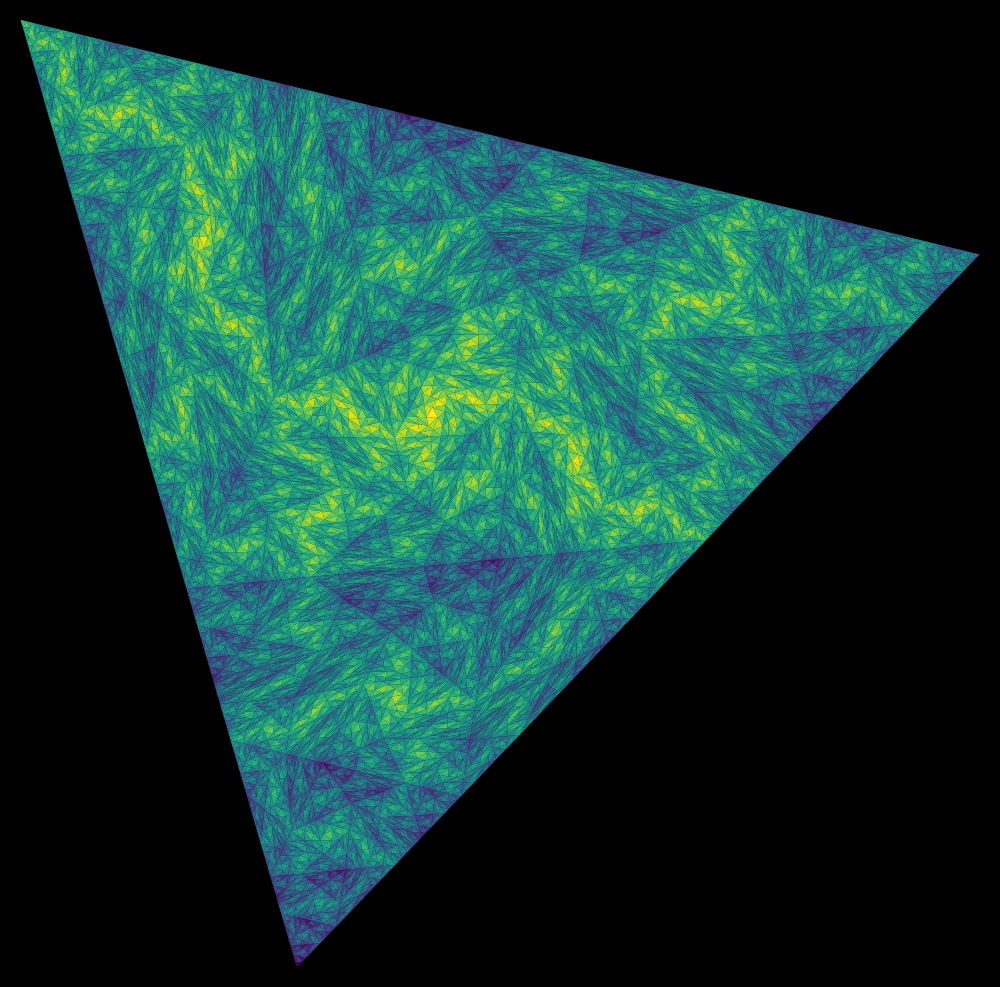
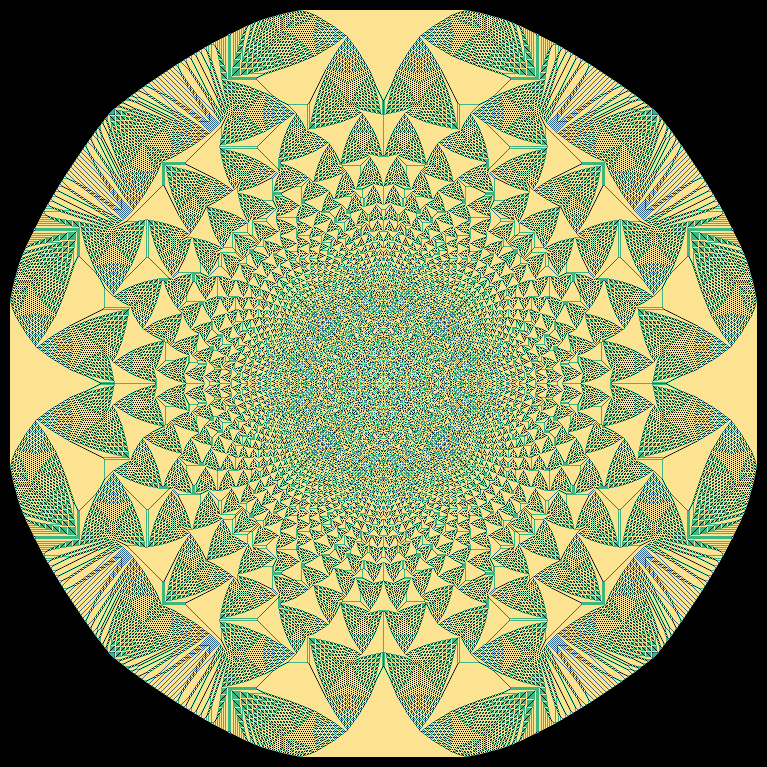
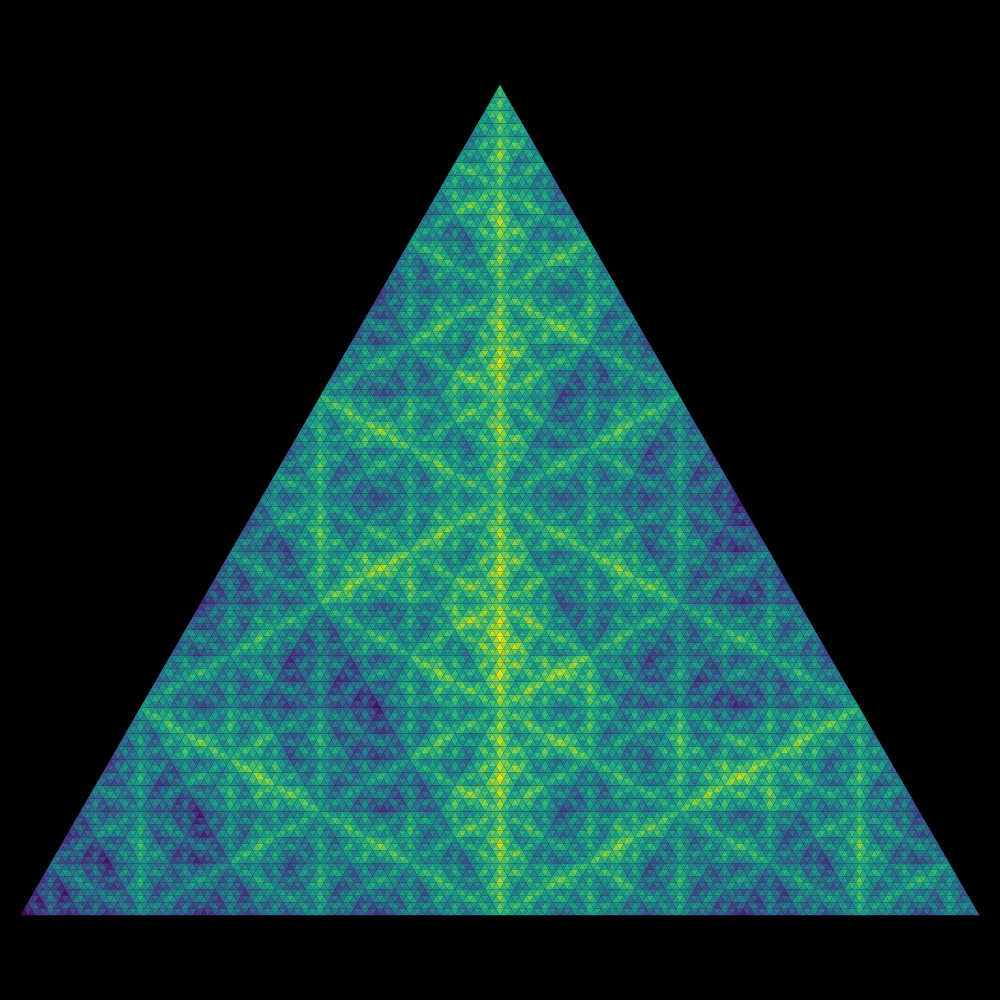
This is an iteration of a fractal tiling. We have a rule for dividing a triangle into four triangular pieces (the rule I picked looks sort of like a lopsided triforce). Then, we iterate this rule by applying it to each of the four pieces, and to each of their pieces, and so on, recursively.
(If we had picked a non-lopsided rule, we'd get a regular triangular lattice. Here is what it would look like, with the same coloring rule: much less exciting! If we do this, but delete every middle triangle, we get the Sierpinski triangle.)
I found this method of generating a fractal tiling in the paper "Fractal Tiling" by Michael Barnsley and Andrew Vince (arXiv link).